

Technical and fundamental research update on Nifty
Technical and fundamental research update on nifty.
Click on the charts to enlarge
Technical view on nifty:
As per our research currently nifty is possibly towards end of an 18-20 year cycle. The monthly chart of nifty is given below with plot of impulse wave patterns. Possibly we are on 5th wave from 2009. There are subdivisions in 5th wave and now we are probably on 5.5 (from 2016).
Nifty Monthly chart
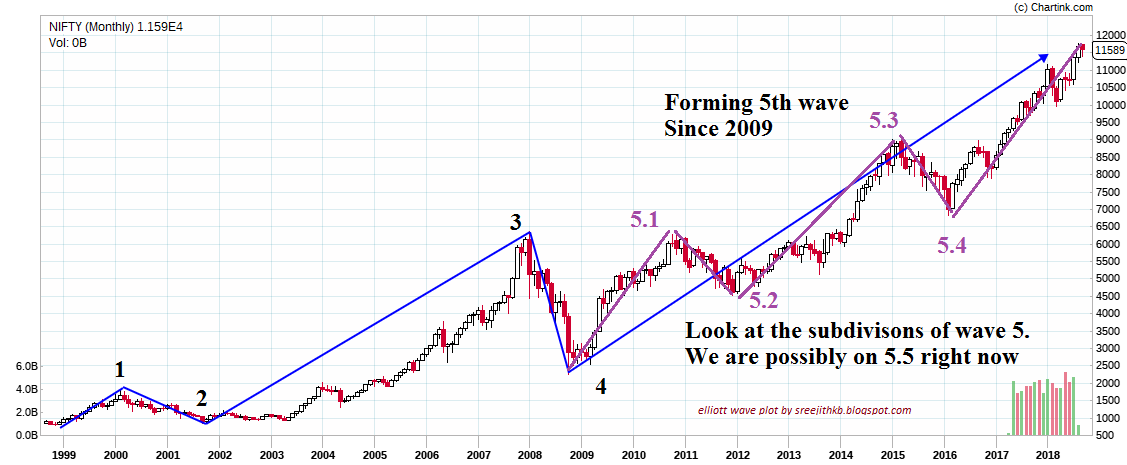
Normally in simple impulse patterns if the third wave is largest, the fifth wave will be probably same as that of first wave. But In this case there are subdivisions in 5.5, so let us look into sub divisions.
Subdivisions of 5.5 from 2016 (Nifty weekly chart)
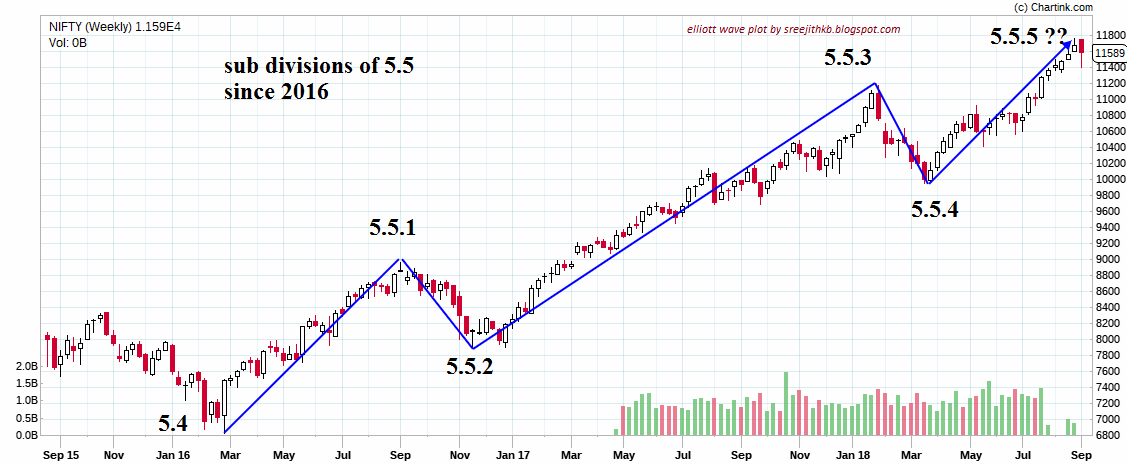
So the impluse wave 5.5 since 2016 is also on an ending note. And to know further lets look in to the subdivions of the impulse wave 5.5.5 since 23rd of march 2018
Subdivisions of the impulse wave 5.5.5 since March 2018 (Nifty Hourly chart)
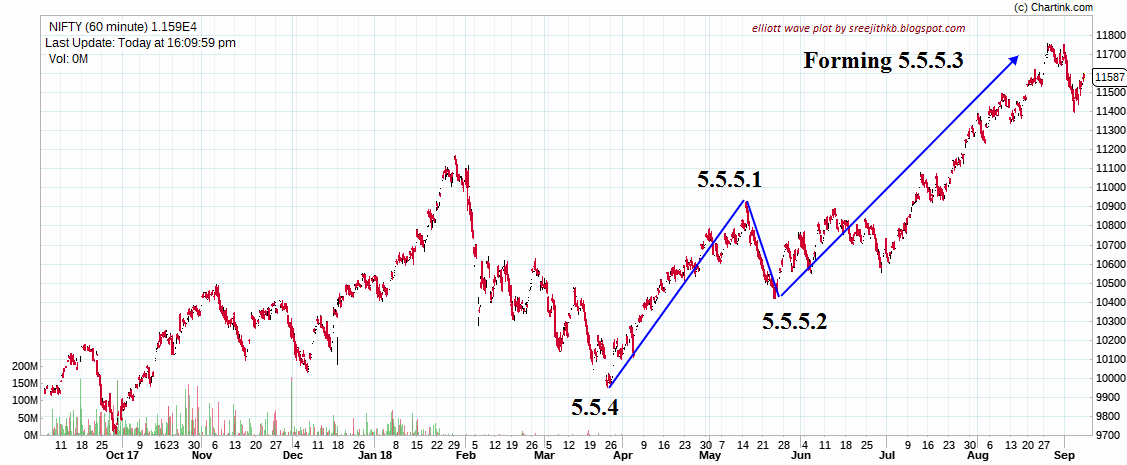
Formation of 5.5.5 is going on. And currently it is on formation of third wave of 5.5.5 (ie 5.5.5.3). The impulse wave 5.5.5.3 since 23rdmay 2018 also has subdivisions and lets check that too.
Subdivisions of impulse wave 5.5.5.3 since 23rdmay 2018 (Nifty 15min chart)
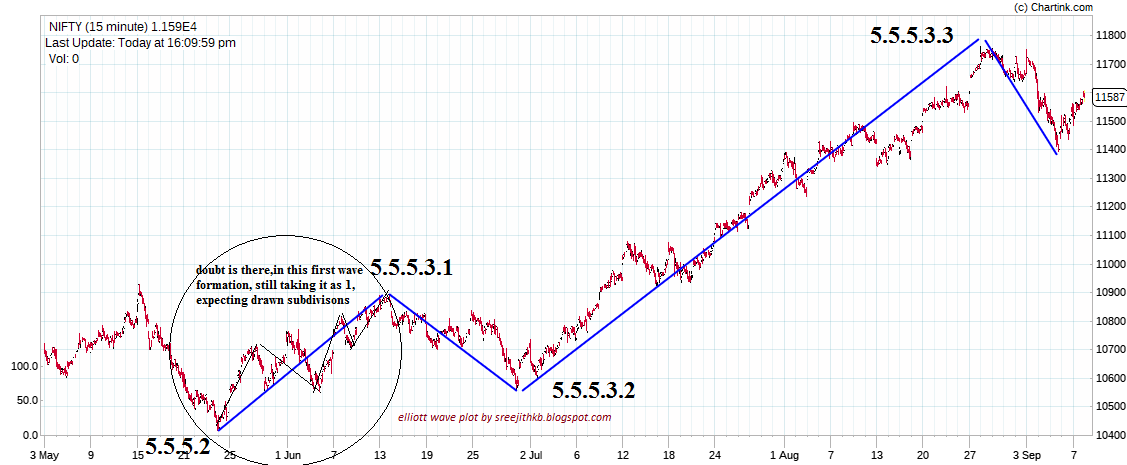
So the formation of 5.5.5.3.3 is over and as per normal guidelines the possible expectation of 5.5.5.3.4 was towards 11500 ( i.e. 0.38% of wave 3). And rule is that it should not cross below the high of wave 1 i.e (10900).
Now lets check what is happening on 5.5.5.3.4 formation (Nifty 5min chart)
It is 4th wave correction and complex correction pattern of ABC seems to be forming ( variation can occur)

As per normal conditions , the target of C , could be upto 11,000 ( ie1.618% of A), taking consideration of the above mentioned rule of 10900, we could see good support from 10,900-11,000 levels. As of now (E.O.D 11/9/2018), it already started C formation , need to wait and watch in which pattern it unveils.
So after the formation of 5.5.5.3.4, we may go for 5.5.5.3.5 ( ie. End of 5.5.5.3)
Now in to the speculative part,
Normal targets of 5.5.5.3 could be around 11900-12000 ( variations can occur).
Normal target of 5.5.5.4 could be 11400 ( variations can occur).
Normal target of 5.5.5.5 (i.e. finish of 5.5.5) could be 12300-12400 ( variations can occur)
The finish of 5.5.5.5 is also the finish of 5.5.5 and 5.5,and it is also the finish of 5th wave from 2009.
I’m not writing about exact time scale projections of these waves as of now, but entire patterns are expected to be completed in few months time, lets see how it goes.
So technically there are possibilities of a 18 yr cycle ending and we could see correction ( just consider it as a speculative view.). I would say it is time to remember the Warren Buffet quote “it is wise to be Fearful when others are greedy and greedy when others are fearful.”
I am a long time participant of this website and had posted a bearish view on nifty in 2013 from 6000 levels, expecting first target as 5000 levels. It do hit 5100 levels in august 2013 but from there nifty went up to this levels . and after that I went in to long research of what went wrong, and the conclusion is that the fundamentals are the driving force and technical analysis is the path for the price movement, both are interdependent and we need to check both.
So Lets check fair valuation of nifty // this is based on our on going research and we don’t claim any validity.
Nifty Valuation Chart

This chart is the plot of nifty fair value (as per our research) and nifty closing prices since 2006. Red line
Is the fair value and blue is the closing prices of nifty.
No one can predict either how long it will stay in overvalued /under valued zone or when the buying or selling can come. It can stay in overvalued zone for months or years. It all depends on market sentiments,supply & demand and technicals also.
Now let us see what happened in 2013.
In 2013, it was undervalued and sell view from the technicals was not a good idea. See the rise in fair valuations from 2014 and market price also rise with that.( it was due to the better performance to listed companies).
So what is the situation now.
We are flat on valuations since few years but market price is rising,which we call it a divergence. So if the valuations decrease or wont rise further, the value investors would be looking for a better exit price.
So both technically and fundamentally there is a correlated conclusion.
About Author
Written by Dr. Sreejith K B (sreejithkb.blogspot.com). Author has written this post for www.nseguide.com
Disclaimer > Author is not a sebi registered research analyst.This post is to be considered as expression of personal view only. “Technical analyses relating to the demand and supply for a particular sector or index is exempted from the purview of the RA Regulations”
Similar Posts:

Latest Query
- by Sam
Market Stats

Search Our Archives
Research Desk
- Stocks Trading above their 50 day moving average - DMA In Stock Research
- Download free Ebooks based on Technical Analysis In Personal Training
- TOP 100 Stocks with the Highest P/E as on July 14th, 2013 In Stock Research
- TOP 100 Stocks with the Lowest P/E as on July 14th, 2013 In Stock Research
- Charting Pathsala - Your guide to Techincals In Technical Analysis

